
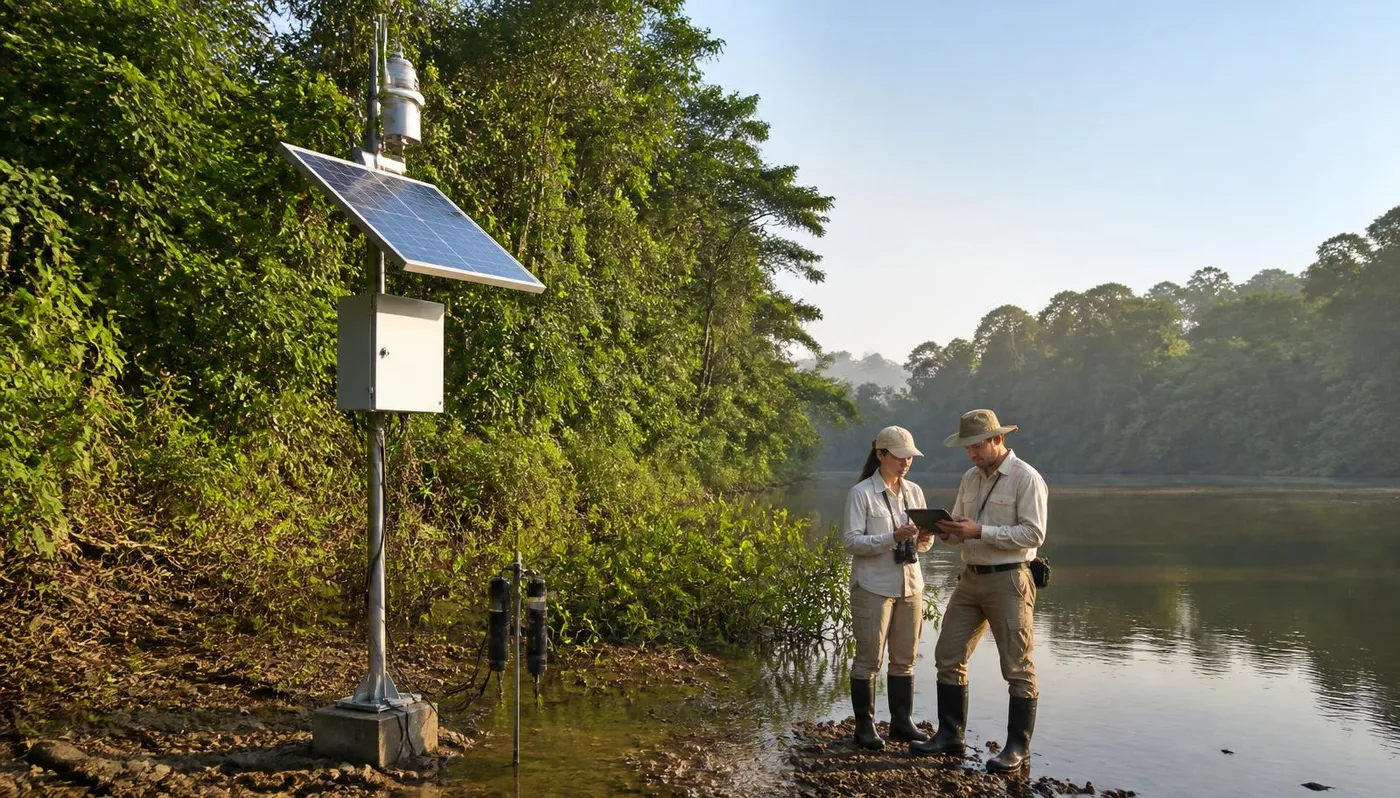
Technology for Environmental Conservation: IoT, Sensors, Satellites, and Real-Time Data
Conservation is no longer just enforcement; it has become data engineering. This guide shows what conservation tech is, how IoT, field sensors, and remote sensing monitor water, soil, air, and wildlife, what data can be collected in real-time, how to transform measurement into alerts and decisions, which business models are sustainable, and how to validate an environmental PoC with scientific partners.
For decades, environmental conservation was synonymous with physical presence: park rangers patrolling trails, inspectors arriving after the damage was done, annual reports written with data collected manually months prior. Today, there's a new layer between the territory and the decision—sensors, satellites, and software. This is what the market calls conservation tech or nature tech.
The change is not just in the instrument; it's in the response time. Knowing a river received an anomalous organic load twelve hours later allows for action; knowing six months later only allows for recording it. Knowing that soil temperature in a restored area consistently dropped over three seasons is evidence of recovery; a pretty photo is not. Technology comes in exactly there: shortening the interval between what happens in the environment and what someone can do about it.
This guide covers the complete path for those who want to build products in this area: the problem conservation tech solves, how each family of sensors works, what data can be collected in real-time, how to turn telemetry into an actionable alert, which business models actually pay the bills, how to validate an environmental proof of concept with scientific rigor, and a reference data architecture to start without reinventing the wheel.
💡 The biggest mistake founders make: starting with the hardware. Installing sensors is the easy and cheap part. What takes work—and where the value lies—is ensuring reliable data, continuous historical series, and an alert that someone has the authority and routine to address.
What is conservation tech and what problems does it solve?
Conservation tech is the use of technology—connected sensors, satellite imagery, bioacoustics, computer vision, predictive models, and data platforms—to observe, understand, and protect ecosystems. It's not a product category; it's a layer that cuts across sanitation, agribusiness, energy, mining, protected area management, insurance, and rural credit.
IPBES's global assessment made it clear that biodiversity loss is accelerated by known drivers: land-use change, direct exploitation of organisms, climate change, pollution, and invasive species. All of them have measurable signatures. The historical problem has never been the absence of phenomena to measure, but rather the absence of continuous, comparable, and cheap enough measurement to become routine.
Invisibility of Damage (Cumulative Processes)
Environmental degradation rarely manifests as a sudden catastrophic event; most of the time, it's cumulative and silent. Point-source effluent discharges or small clearings seem harmless in isolated measurements, but they accumulate a critical liability over time. Continuous monitoring by sensors and satellites transforms sparse readings into auditable time series, making the real trend visible before the damage becomes irreversible.
The cutout that separates a project from a product
A conservation project delivers a report at the end of a funding period. A conservation product delivers a recurring decision to someone accountable for it: the treatment plant manager who needs to know when to adjust dosing, the commodity buyer who needs to validate origin before closing the contract, the agency that needs to prioritize which of two hundred reports to inspect first. The question to ask before writing any code is simple: who loses money, time, or a license if this data doesn't exist?
Have a nature tech idea and want to get it off the ground?
Shinier accelerates tech startups with a method: persona definition, requirements, proof of concept, architecture, and roadmap. In environmental conservation, this means moving from field intuition to a defensible PoC in front of a scientific partner, investor, and paying client.
For early-stage founders
Use the platform's requirements, project modeling, and roadmap tools to design your environmental PoC with clear scope, hypothesis, and success criteria.
For companies and institutions
Need an environmental monitoring platform integrated with sensors, images, and compliance reports? Talk to the Shinier team.
How do IoT, sensors, and satellites monitor water, soil, air, and wildlife?
There are three scales of observation and they do not compete; they fit together. Remote sensing by satellite covers large areas with fixed periodicity and long history. Aerial sensing by drone covers tens or hundreds of hectares on demand with high resolution. Field sensing via IoT devices covers specific points with very high frequency. The rule of thumb is to use the satellite to detect where something changed, the drone to inspect, and the sensor to continuously track what matters.
Connectivity defines the project as much as the sensor does. In areas with cellular coverage, an LTE-M or NB-IoT module works. In remote areas, low-power wide-area networks (LoRaWAN) with their own gateway or satellite communication become the only viable option—and they completely change the power budget, transmission interval, and cost per monitored point.
Water
Multiparameter sondes measure pH, turbidity, conductivity, dissolved oxygen, temperature, and level. Connected staff gauges and flow sensors complete the hydrological picture. In effluents, continuous measurement at the outlet detects process deviations before the monthly lab analysis.
Soil
Moisture sensors at different depths, temperature, electrical conductivity, and organic matter indicate compaction, erosion, and recovery of restored areas. Combined with satellite-derived vegetation indices, they show if the planting actually took hold.
Air
Low-cost stations measure particulate matter, gases, and local meteorological variables. Isolated, they have high uncertainty; in a dense network calibrated against a reference station, they reveal spatial patterns that a single official station never captures.
Flora and fauna
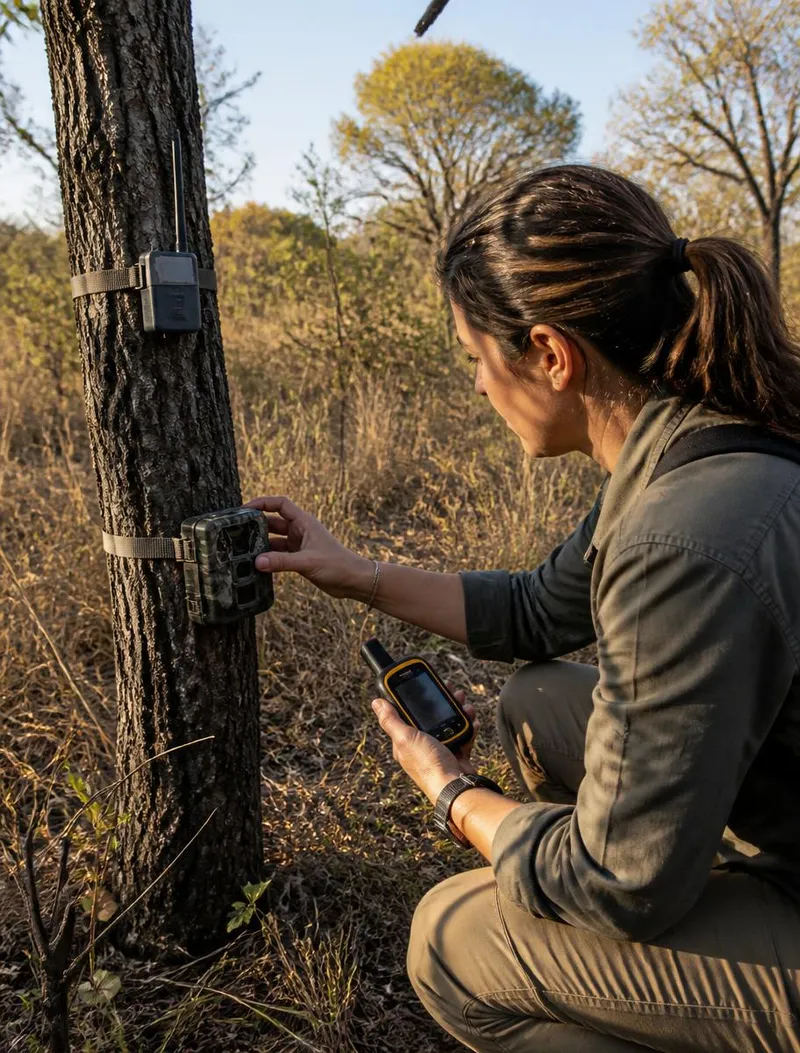
Camera traps with computer vision identify species and estimate occurrence frequency. Bioacoustic recorders detect birds, amphibians, and bats by vocalization. GPS collars and bands reveal routes, territories, and conflicts with human activity.
| Technology | Coverage | Typical Frequency | Best Use |
|---|---|---|---|
| Optical satellite | Regional to continental | Days to weeks | Land use change, deforestation, vegetation indices |
| Radar satellite | Regional to continental | Days | Detection under clouds and during rainy seasons, moisture, and structure |
| Drone | Local (tens of hectares) | On demand | Detailed inspection, counting, 3D terrain modeling |
| IoT field sensor | Point | Minutes to hours | Water, soil, air, and noise with continuous series and immediate alerts |
| Bioacoustics and cameras | Point to local | Continuous with batch processing | Species presence and frequency, hunting pressure, and traffic |
What environmental data can be collected in real-time?
Real-time, in conservation, almost never means milliseconds. It means a frequency lower than the time in which the decision is still useful. River level in a headwater subject to flash floods requires readings every five minutes; soil moisture in a restored area can be read every hour with no loss; vegetation cover changes on a seasonal scale.
Defining this cadence correctly is an architecture and cost decision. Transmitting too much data consumes battery, saturates the network, and generates expensive storage without improving any decision. A good practice is to measure at high frequency locally, aggregate on the device (min, max, average, deviation), and transmit only the aggregate—making an exception for immediate transmission when a value crosses a threshold.
High cadence (minutes)
- Level and flow of water bodies
- Turbidity and conductivity in effluents
- Particulate matter in construction or mining areas
- Noise in sensitive wildlife areas
Medium cadence (hours)
- Soil moisture and temperature
- pH and dissolved oxygen in lentic bodies
- Local meteorological variables
- Water and energy consumption of operations
Low cadence (days to months)
- Satellite land cover and use
- Vegetation and water stress indices
- Species richness via processed bioacoustics
- Reported waste and emissions balance
Raw data is not information
Every sensor drifts. A turbidity sonde gets dirty, a pH electrode ages, a solar panel gets covered in dust, and battery performance drops in winter. Without a calibration routine, without identifying impossible readings, and without maintenance logs, the series becomes fiction with the appearance of rigor. A serious system treats metadata—calibration date, firmware version, installation conditions—as part of the data, not as an attachment.
How to transform monitoring into alerts and operational decisions?
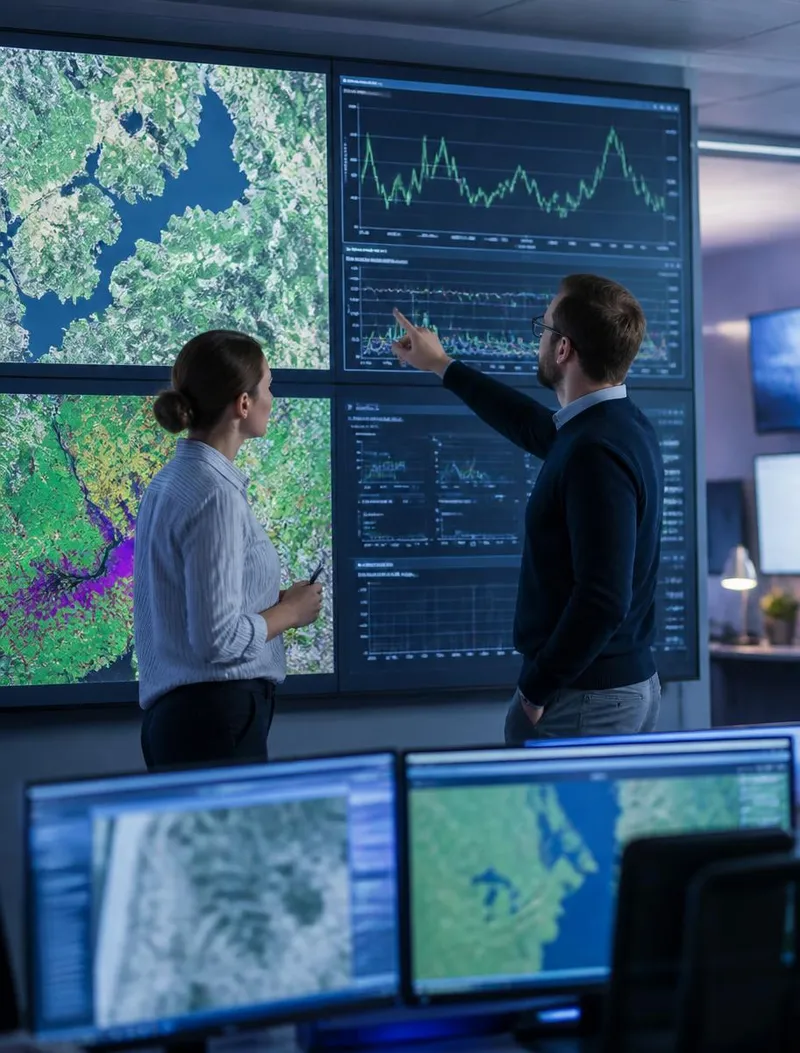
A pretty dashboard doesn't change behavior. What changes behavior is an alert that reaches the right person, on the channel they use, with enough context to act, and with an associated procedure. Every alert must answer four questions: what happened, where, what is the severity, and what to do now.
Define thresholds on a scientific basis
Arbitrary thresholds generate false alarms and train the team to ignore notifications. Anchor them in applicable legislation, literature reference ranges, or the baseline measured on-site during a learning period.
Separate anomaly from trend
An isolated spike might be dirt on the sonde; three consecutive readings above the threshold in a moving window is an event. A downward monthly trend over two quarters is another type of alert, with another recipient and another deadline.
Classify severity and route
An informational level goes to a weekly report; an attention level triggers the field technician; a critical level triggers coordination and formal logging. Without this hierarchy, everything becomes an emergency and nothing gets addressed.
Close the loop with evidence of action
The alert only ends when someone logs what was done and the system shows the variable returning to normal. This alert-resolution pair is what proves value to the client at contract renewal time.
The metric that matters: the rate of alerts addressed on time and the proportion of false positives. If more than half the alerts generate no action, the problem isn't the field team—it's the threshold, the channel, or the relevance of what is being measured.
What business models exist for conservation startups?
The question that brings down most nature tech ideas is who pays. Donations and grants fund pilots, not scale. The models below are the ones that effectively sustain recurring operations—and nothing prevents combining them, as long as the paying client is explicit from day one.
Monitoring as a Service (MaaS)
The startup installs, maintains, and calibrates the sensor network and charges a monthly fee per monitored point, with dashboard and reports included. Reduces capital friction for the client and creates predictable recurring revenue, but requires field logistics and parts inventory.
Data and intelligence by subscription
No proprietary hardware: the startup combines public sources of remote sensing, meteorological data, and registries to generate territorial analysis. High margin and fast scale, with the challenge of proving accuracy and differentiating from open data.
Compliance and reporting
Product oriented toward an obligation: environmental licensing, conditions, nature-related disclosure, international buyer requirements. The pain point is clear, the budget exists, and the sales cycle is long, but renewal tends to be high.
Environmental asset verification
Continuous monitoring that supports restoration, credit, and payment for environmental services projects. Requires traceability and third-party accepted methodology—this is where scientific rigor becomes a real barrier to entry.
Embedded layer in another supply chain
Selling environmental information within an existing workflow: rural credit, agricultural insurance, commodity purchasing, sanitation management. The client doesn't buy 'conservation'; they buy risk reduction for their operation.
Hardware with software license
Equipment sales with a mandatory platform subscription. Funds growth with cash from the initial sale, but beware: without significant recurring revenue, the company becomes an equipment reseller with tight margins.
The advantage of starting with open data
Before buying the first sensor, it's possible to build and sell value using public land cover and use databases, free satellite imagery, official hydrological and meteorological series, and territorial registries. This allows validating the willingness to pay with near-zero hardware investment—and only then installing equipment where open data demonstrably falls short.
How to validate an environmental PoC with scientific partners?
An environmental proof of concept has a requirement that ordinary software does not: it must withstand the scrutiny of domain experts. Universities, research institutes, basin committees, protected areas, and cooperatives are natural partners—they have the land, protocol, reference method, and credibility, and they typically lack exactly the technological layer the startup brings.
Hypothesis before equipment
Write the sentence the PoC will confirm or refute: 'Turbidity sensors installed at three points detect solid load events at least 24 hours in advance compared to the monthly lab campaign.' If it doesn't fit into a testable sentence, it's not a PoC.
Side-by-side reference method
Install the sensor where traditional collection already happens and compare. Without this pairing, there is no measure of accuracy, and without declared accuracy, no scientific partner signs off on the result.
Window that covers seasonality
Thirty days of pilot testing in the dry season say nothing about the system's behavior in the rain. Choose a window that crosses at least one seasonal transition relevant to the monitored phenomenon.
Pre-agreed success criteria
Define in advance the minimum valid data rate, acceptable error against the reference method, maximum downtime, and the number of operational decisions effectively made based on the alerts.
Combine what belongs to whom before starting
A scientific partnership without a written agreement ends in conflict. Make explicit who owns the raw data, who can publish what and in what timeframe, how authorship will be attributed, what license applies to derived data, and what happens to the equipment at the end of the pilot. It's also worth registering the necessary authorizations from the start—accessing protected areas, handling wildlife, and using images have their own rules, and discovering this midway through collection costs the entire schedule.
Example of data architecture for environmental monitoring
The architecture below works just as well for a network of twenty sensors as it does for thousands of points, scaling appropriately. The principle is to separate layers so that a field failure does not corrupt history and changing hardware vendors doesn't require rewriting the platform.
Collection and edge
Devices with versioned firmware, synchronized clocks, local buffering for periods without connectivity, and aggregation on the node itself. Each packet carries a device identifier, timestamp, value, unit, and quality indicator.
Transport
Lightweight protocols (MQTT, CoAP) over LoRaWAN, NB-IoT, LTE-M, or satellite, depending on coverage. Per-device authentication, encryption in transit, and a retransmission policy for lost packets.
Ingestion
A single entry point that validates schema, rejects physically impossible readings, logs everything in an immutable raw layer, and only then forwards it for processing. Never overwrite the original data.
Storage
Time-series databases for telemetry, a relational database with geospatial extension for point, area, and event registries, and object storage for images, audio, and satellite scenes. Retention and aggregation policies based on data age.
Processing and quality
Cleaning routines, gap filling declared as such, application of calibration curves, index calculation, and anomaly detection. Every transformation logged in lineage so that any displayed number can be traced back to the original reading.
Rules, alerts, and integrations
Rules engine with configurable thresholds per point, severity-based routing, dispatch via app, email, and messaging, plus an API to integrate with the ERP, work order system, or environmental agency dashboard.
Visualization and reporting
Layered maps, comparable time series across points, export in open formats, and compliance-ready reports—with calibration metadata and data coverage visible, not hidden in a footer.
Frequently Asked Questions
- What is conservation tech?
- It's the set of technologies applied to environmental conservation: IoT sensors, bioacoustics, camera traps, drones, remote sensing via satellite, wildlife tracking, and data platforms that transform dispersed measurements into operational decisions about territory, water, soil, air, and biodiversity.
- What is the difference between satellite monitoring and field sensors?
- Satellites provide broad coverage and consistent history, but with limited spatial and temporal resolution and little information on what happens beneath the canopy or underwater. Field sensors provide high frequency and local depth but cover specific points. The two complement each other: the satellite indicates where to look, the sensor explains what is happening.
- How to validate an environmental PoC?
- With a measurable hypothesis, a defined pilot area, a collection protocol agreed upon with a scientific partner, a minimum period that covers relevant seasonality, and success criteria defined before starting—including valid data rate, accuracy against a reference method, and operational utility of the generated alert.
- Is there a paying market for environmental data?
- Yes. Regulatory pressure, nature-related disclosure commitments, and supply chain demands have created concrete buyers: companies that need to prove compliance, financiers that need to monitor their portfolio, producers that need to demonstrate origin, and agencies that need to enforce with evidence.
Wrapping up: conservation at scale depends on cheap, continuous, and reliable evidence. Whoever builds the layer that transforms a sensor into a decision is not just making environmental tech—they are creating the information infrastructure upon which policies, contracts, and investments will rely over the next decade.
Referências
- IUCN. Global Conservation Reports. A reference because the International Union for Conservation of Nature maintains global standards for species and protected areas assessment, as well as monitoring methodologies that define what counts as conservation evidence. Any conservation tech startup needs these criteria to avoid inventing their own metrics without comparability. Learn about IUCN's work
- CONVENTION ON BIOLOGICAL DIVERSITY. Kunming-Montreal Global Biodiversity Framework. A reference because it establishes global biodiversity targets for 2030—including the protection of 30% of land and seas and restoration of degraded ecosystems—and defines the tracking indicators that guide public policies and corporate commitments. It's the demand map for those building monitoring tech. View the global biodiversity framework
- MAPBIOMAS. Land cover and land use collections. A reference because it demonstrates, with open Brazilian data and annual historical series, that remote sensing and automated classification can generate reliable territorial information on a continental scale. It serves as a cartographic base and methodological proof of concept for monitoring products. Explore the collections
- TNFD. Recommendations for Nature-related Financial Disclosures. A reference because it translates environmental risk into financial language: nature-related dependencies, impacts, risks, and opportunities, with a disclosure structure comparable to climate reporting. It's what turns environmental data into a reporting obligation—and thus into a paying market. Read the recommendations
- IPBES. Global Assessment Report on Biodiversity and Ecosystem Services. A reference because it consolidated the most comprehensive scientific assessment ever made on biodiversity loss and ecosystem services, pointing out the five main drivers of degradation. It defines the problem that conservation technology tries to address and provides the scientific basis to prioritize where to monitor. Access the global assessment
Build your conservation tech startup with method
At Shinier Accelerator you structure requirements, proof of concept, data architecture, and roadmap with mentoring—from field pilot to paying product.
Get to know Shinier Accelerator