
Pollution Indicators for Companies: ISO 14001, ISO 14031, and Reduction Plan
Pollution only becomes manageable when it becomes a number with an owner, unit, and deadline. This guide shows which indicators ISO 14031 recommends, how to measure waste, energy, water, emissions, and effluents, how to turn ISO 14001 requirements into operational goals, how to log neighborhood complaints, and how to build a monthly environmental performance dashboard that withstands an audit.
There is a huge distance between a company that says it cares about the environment and a company that knows, in numbers, how much waste it generated per ton produced last month. The first has a speech; the second has management. Pollution indicators are exactly what separates the two: they convert diffuse impact into comparable data, with a unit, boundary, responsible person, and goal.
The good news is that there's no need to invent this benchmark. ISO 14001 defines how to structure an auditable environmental management system, and ISO 14031 specifically guides environmental performance evaluation — which indicators to choose, how to collect, how to analyze, and how to communicate. The GRI Standards standardize the disclosure of materials, energy, water, emissions, and waste, and local Solid Waste Policies define the legal hierarchy of disposal.
In this guide, we walk the full path: what pollution indicators are and why measure them, what ISO 14031 recommends tracking, how to measure each impact family, how to transform normative requirements into goals the operation controls, how to log neighborhood complaints and risks, an example of a monthly dashboard, and a checklist to build the reduction plan.
💡 The most common mistake: measuring only absolute totals. A factory that grows 30% and reduces absolute waste by 5% has improved a lot — but the absolute number hides that. Always track the indicator in two readings: absolute value (real impact on the planet) and value per unit produced (process efficiency).
What are pollution indicators and why measure them?
A pollution indicator is a quantitative measure of the burden the organization places on the air, water, soil, and waste system, added to the effectiveness measures of the controls it maintains to reduce that burden. It is not a sustainability report number: it is operational data, with the same collection discipline that a company applies to revenue or hours billed.
The United Nations Environment Programme treats pollution as one of the three great planetary risks, alongside climate change and biodiversity loss — and most of this load is generated by private productive operations. Measuring, at the company level, is the only way out of a generic commitment into a concrete decision: changing a solvent, resizing a boiler, segregating a waste at the source, reusing cooling water.
1. Compliance
Permits and operational licenses require continuous measurement to avoid fines and embargoes.
2. Direct Cost
Effluents and emissions are inputs paid for without becoming final product. Reducing effluent cuts OPEX.
3. ESG Market
Large corporations require GRI data to qualify suppliers in B2B bids.
4. Protection
Transparent telemetry mitigates environmental liabilities and shields brand value from investors.
An indicator is only useful if it has five attributes
Explicit unit (kg, m³, kWh, tCO₂e), defined boundary (which plant, which process, which shifts), traceable data source (waste invoice, meter, lab report), fixed periodicity, and named owner. An indicator without a boundary generates endless arguments about what counts; an indicator without a traceable source doesn't survive an audit; an indicator without an owner doesn't improve.
Turn pollution indicators into innovation and impact opportunities
The Shinier Accelerator connects those developing sustainable technological solutions to companies looking to efficiently evolve their environmental indicators.
Want to build a startup that acts as a solution for this indicator?
If you want to build an environmental impact software, hardware, or service focused on measuring, monitoring, or reducing waste, energy, water, or emissions, use the Shinier Accelerator to validate the thesis, structure the MVP, and accelerate your business roadmap.
Want to improve this indicator and looking for impact startups?
If your company needs to reduce waste and meet environmental goals agilely, we help structure your indicators and connect/develop partnerships with impact startups that offer customized technical solutions.
Which indicators does ISO 14031 recommend tracking?
ISO 14031:2021 is the standard dedicated to environmental performance evaluation and organizes indicators into three complementary categories. The 2021 edition reinforces the link between indicators and decision-making, in addition to aligning with the environmental management structure of ISO 14001:2015. Conscious choice between them avoids the most common unbalanced dashboard of companies: ten process output indicators and no indicators on the management that produces those results.
OPI — Operational Performance
Measures physical inputs and outputs of the process: raw materials consumed, energy, water, waste generated, effluents discharged, air emissions, noise, and internal reuse.
These are the indicators that the operation sees on the factory floor and can change in short cycles, adjusting setups, maintenance, and procedures.
MPI — Management Performance
Measures the quality of the management system: percentage of environmental goals met, corrective actions closed on time, environmental training hours, internal audits conducted, suppliers evaluated by environmental criteria.
These are leading indicators: when they drop, the operational result gets worse two or three months later.
ECI — Environmental Condition
Measures the state of the surrounding environment: air and water quality in the receiving body, soil quality, noise level at the property boundary, local vegetation condition.
They do not depend solely on the company, but they contextualize the impact and support the conversation with environmental agencies and the community.
🎯 Practical ratio: a balanced dashboard usually has about 60% operational indicators, 30% management indicators, and 10% environmental condition indicators. If your dashboard only has OPIs, you measure the symptom without measuring the cause; if it only has MPIs, you measure bureaucracy without measuring impact.
How to measure waste, energy consumption, water, emissions, and effluents?
Each family has its own data source, unit, and trap. The table below is the minimum core we recommend, aligned with GRI Standards 301, 302, 303, 305, and 306 so that the number generated internally is already useful for external reporting without rework.
| Family | Indicator and unit | Data source | Reference |
|---|---|---|---|
| Waste | kg generated & kg per unit produced; % diverted from landfill | Waste transport manifest and weighing at dispatch | GRI 306 |
| Energy | Total kWh, kWh per unit produced, and % from renewable sources | Utility bill and sector meters | GRI 302 |
| Water | m³ withdrawn, m³ reused, and % reuse vs. withdrawal | Water meter, permit, and reuse log | GRI 303 |
| Emissions | Scope 1 & 2 tCO₂e; particulate matter in mg/Nm³ | Fuel consumption, energy bill, and stack test report | GRI 305 |
| Effluents | m³ discharged, BOD/COD in mg/L, and % lab report compliance | Flow meter and accredited lab report | GRI 303 |
| Materials | % recycled input and raw material loss per batch | Supplier technical sheet and production log | GRI 301 |
Traps in waste
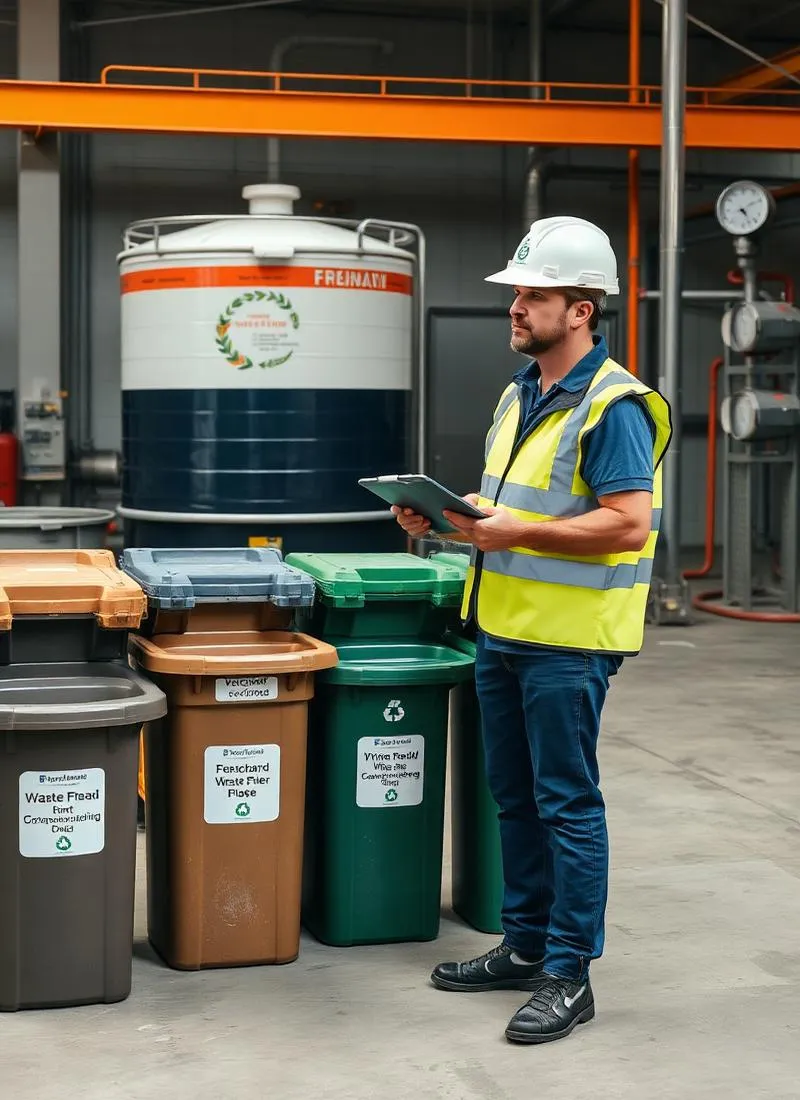
Estimating weight by dumpster volume, mixing hazardous waste with common waste due to a lack of segregation at the source, and considering co-processing as recycling are the three most frequent errors. Local laws usually impose a hierarchy: first do not generate, then reduce, reuse, recycle, treat, and only then dispose. The indicator must reflect this order, not just the total disposed.
Traps in water and effluents
Measuring only the utility bill and ignoring permitted wells, treating a spot sample as the monthly average, and reporting volume without polluting load. High volume with low load and low volume with high load are completely different situations — that is why flow and concentration need to appear together on the dashboard.
How to transform ISO 14001 requirements into operational goals?
ISO 14001 requires the organization to identify its environmental aspects, assess the associated impacts, determine which are significant, and establish objectives with action planning. In practice, this becomes a simple chain that needs to be written in a single living spreadsheet: aspect → impact → indicator → baseline → goal → owner → operational control → evidence.
The point that separates certified systems that work from those that merely survive an audit is the unit of the goal. "Reduce emissions by 10% by December" is a board's intention; no one on the night shift knows what to do with it. The same goal translated to "reduce the specific consumption of the boiler from 42 to 38 m³ of gas per ton of steam, controlling blowdown and feedwater temperature" is an executable instruction, measured daily by the operator.
Each significant aspect must also generate a documented operational control — procedure, startup checklist, preventive maintenance plan, supplier acceptance criteria — and evidence that the control is being executed. Certification auditors look exactly for this tie-in: they don't ask for the speech, they ask for the monitoring record, the handling of non-conformities, and the management review.
Finally, respect the improvement cycle. Annual environmental goals without quarterly review become orphaned numbers. The practical recommendation is to review the baseline every twelve months, progress every three, and raw data every month — the same cadence that ISO 14031 describes in the plan, do, check, act cycle.
How to log environmental complaints and neighborhood risks?
Night noise, odor, dust, soot, truck traffic, and vibration rarely appear in a stack report — but they are the main source of conflict with the community and environmental agency triggers. A complaint is environmental data and needs a formal channel, response deadline, and its own indicator.
The minimum log for each occurrence
- Date, time, and weather conditions at the time (wind and rain change dispersion).
- Declared origin and confirmed origin after investigation.
- Type: noise, odor, dust, effluent, waste, vibration, or traffic.
- Immediate action taken and root cause corrective action, with deadline and owner.
- Formal feedback to the complainant and evidence of contact.
Derived indicators
- Number of complaints in the month and by type.
- Average time until the first feedback to the complainant (goal: 48 hours).
- Percentage of complaints with identified root causes.
- Recurrence: complaints of the same type and origin within 90 days.
- Environmental incidents with potential notification to the competent agency.
Zero complaints is not a good goal
A goal of zero complaints pushes the record under the rug: the front desk stops logging it, the supervisor solves it informally, and the company loses the only early warning it has. The correct goal is about response and recurrence — 100% of complaints logged, answered in 48 hours, and without repeating the same cause in 90 days.
Example of a monthly environmental performance dashboard
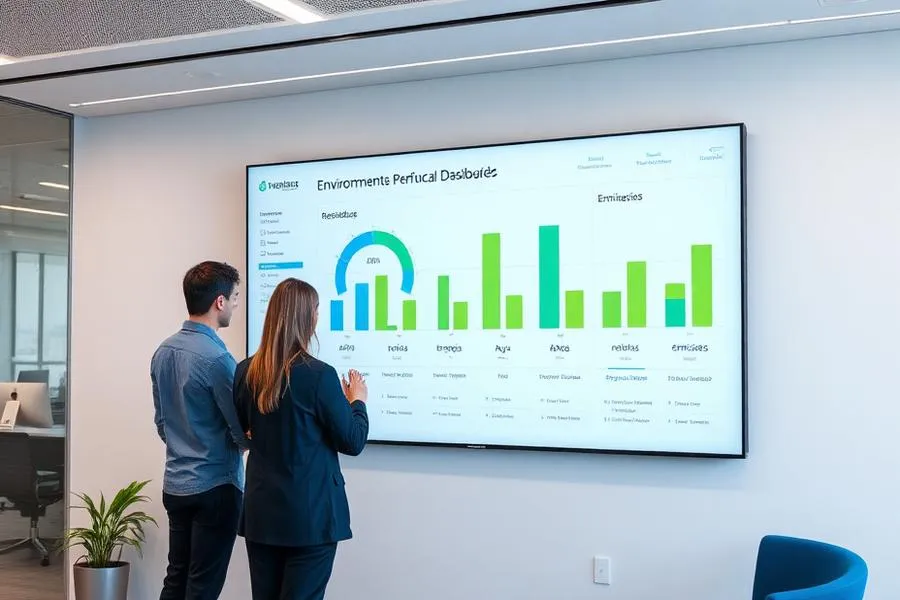
The environmental dashboard that works fits on one screen and is discussed in thirty minutes, always in the same week of the month. The structure we recommend has four blocks, in the order the conversation should happen.
Block 1 — Compliance. Traffic light of valid licenses and conditions, period reports within or outside the legal limit, regulatory deadlines for the next 90 days. Nothing else is discussed before this block is green or has an action plan.
Block 2 — Operational Indicators. Waste per unit produced, % diverted from landfill, kWh per unit, m³ of water withdrawn and % of reuse, tCO₂e Scope 1 and 2, effluent flow and load. Each with three values side by side: current month, average of the last twelve months, and goal.
Block 3 — Management. Open and overdue corrective actions, percentage of goals on time, training conducted, internal audits, and environmental assessment of critical suppliers.
Block 4 — Surroundings and Decisions. Complaints by type, recurrences, incidents, and the short list of decisions made in the meeting with the owner and deadline. Without Block 4, the dashboard becomes a presentation; with it, it becomes management.
Referências
- ISO 14001. Environmental management systems — Requirements with guidance for use. It is a reference because it defines the formal structure of the environmental management system: context, aspects and impacts, legal requirements, environmental objectives, operational control, monitoring, and continuous improvement. It is the standard that transforms environmental intention into an auditable process. Access ISO 14001
- ISO 14031:2021. Environmental management — Environmental performance evaluation (EPE). It is a reference because it is the standard dedicated exclusively to indicators in its updated 2021 edition: it separates operational performance indicators (OPIs), management performance indicators (MPIs), and environmental condition indicators (ECIs), and describes the plan-do-check-act cycle that sustains a reliable dashboard. View the ISO 14031:2021 standard
- UNEP. United Nations Environment Programme. It is a reference because it consolidates global evidence on air, water, soil, waste, and chemical pollution, providing the public health and systemic risk dimension that justifies measuring pollution at the company level, not just the country level. Access UNEP
- GRI. Standards 301 (Materials), 302 (Energy), 303 (Water and Effluents), 305 (Emissions), and 306 (Waste). It is a reference because it standardizes how to disclose each indicator — unit, boundary, calculation methodology, and conversion factor — allowing comparison between companies and preventing each report from inventing its own benchmark. View GRI Standards
- BRAZIL. National Solid Waste Policy — Law No. 12,305/2010. It is a reference because it establishes in Brazil the hierarchy of waste management (non-generation, reduction, reuse, recycling, treatment, and environmentally sound disposal), shared responsibility for the life cycle, and the requirement of a management plan for generators. Read the law
- EXTERNAL ISO AUDITOR. Video on ISO 14001 requirements and auditing. It is a reference because it shows, from the auditor's perspective, what evidence is actually requested in the field — monitoring records, operational control, and handling of non-conformities — which helps design indicators that survive a certification audit. Watch on YouTube