
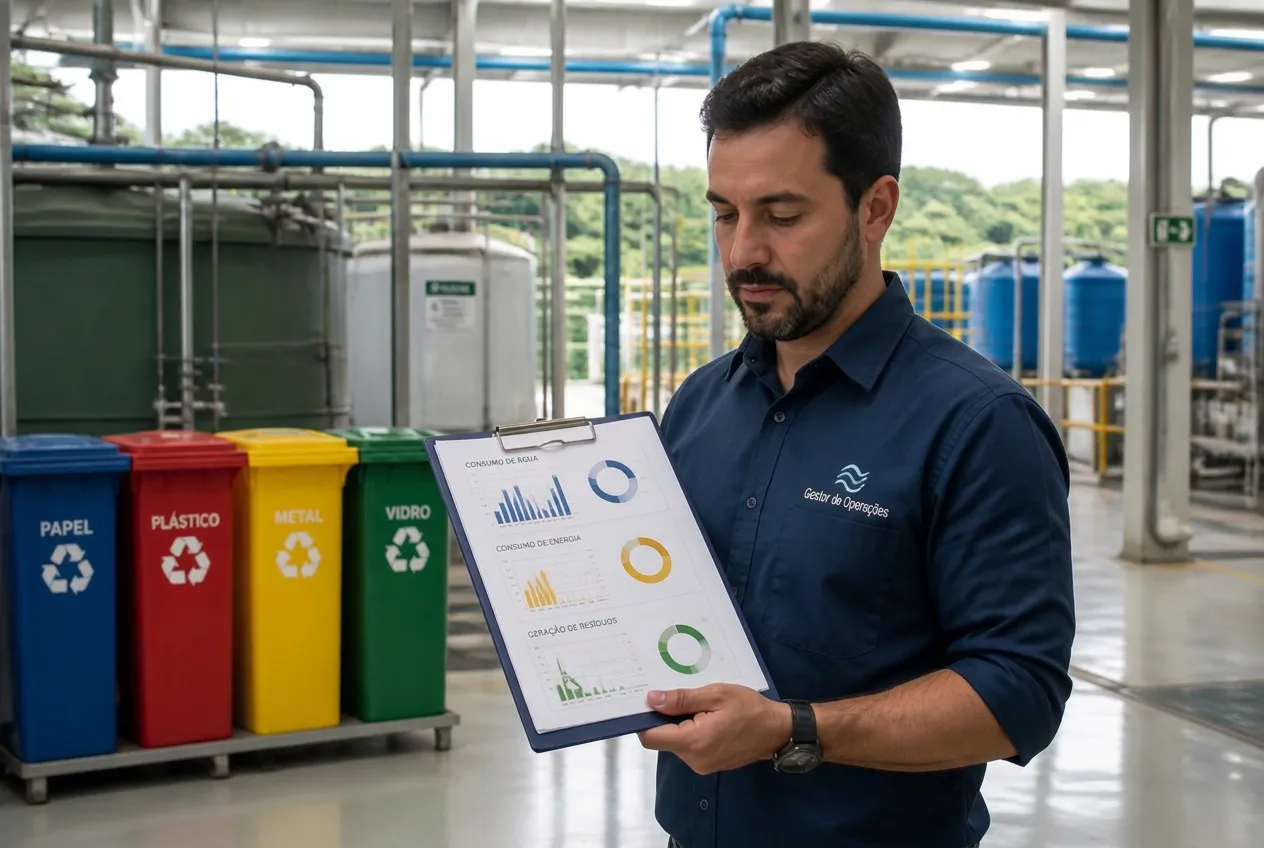
Eco-Efficiency: How to Reduce Water, Energy, Waste, and Costs in a Single Unified Strategy
Curtailing water, energy, and material consumption while slashing operational overhead are not separate initiatives: they represent the exact same engineering project examined through complementary lenses. This guide shows how to formulate the eco-efficiency equation, which paired environmental and financial metrics to track, how to prioritize interventions by ROI, mitigating rebound effects, and what to deliver in the first 90 days.
A recurring conversation unfolds inside nearly every company beginning its sustainability transition: someone proposes cutting water or electrical consumption, and the financial controller hears it as an unbudgeted operational expense. This is an expensive misconception, because in most situations what is being proposed is the exact opposite — ceasing payment for raw resources the operation consumes without converting into commercial value. Eco-efficiency bridges this gap: it formalizes environmental impact reduction as a rigorous productivity ratio, placing economic yields in the numerator and physical resource consumption in the denominator.
The concept originated within enterprise strategy, not environmental activism. The classical formulation defines eco-efficiency as delivering competitively priced goods and services that fulfill human needs and enhance quality of life, while progressively reducing ecological impacts and resource intensity throughout the life cycle. Notice that sacrifice is entirely absent: the goal is not producing less, but producing superior value with reduced physical throughput per monetary unit.
This distinction separates corporate initiatives that endure beyond their second quarter from those discarded at the first budget review. When framed as a commercial sacrifice, eco-efficiency competes against revenue quotas and loses. When articulated as physical resource intensity per dollar invoiced, it embeds into existing corporate P&Ls — defended proactively by the people managing working capital.
💡 The recurring misconception founders make: treating water, energy, and packaging consumption as unavoidable fixed costs. They are almost never fixed. They are unmetered variable costs that compound through minor daily oversights — and every wasted dollar drains profit margins exactly like a forfeited sale.
What is eco-efficiency and why does it drive cost reduction?
Eco-efficiency is an input-output ratio comparing economic value delivered against the physical resources consumed to create it. The numerator tracks net revenue, manufactured units, processed shipments, meals served, active subscribers, or any metric faithfully representing business output. The denominator measures material consumption: cubic meters of water, kilowatt-hours of power, metric tons of raw inputs, kilograms of solid waste. Elevating eco-efficiency means expanding this ratio — achievable exclusively by producing greater value from current inputs or maintaining output with reduced resource intensity.
The arithmetic underlying cost reduction is straightforward. Every denominator unit was procured: water carries municipal tariffs, energy incurs utility invoices, materials require supplier payments, and waste demands collection and tipping fees — while embedding the forfeited cost of raw inputs turned into scrap. Shrinking the denominator directly reduces cash outflows without sacrificing production volume or quality: it simply cuts resources that never became marketable products.
A secondary operational effect is equally decisive. Excessive resource consumption almost universally signals underlying process instability: leaks reveal neglected maintenance, electrical demand spikes reflect equipment operating outside optimal performance envelopes, and excessive waste generation flags flawed procurement specifications or defective runs. Monitoring resource intensity serves as an early operational fault detector that standard accounting cannot reveal because it aggregates disparate losses into passive expense lines.
Water
Intake, purification, process cooling, CIP sanitation, and effluent treatment. The true cost per cubic meter aggregates input tariffs, pumping and boiler heating power, treatment chemicals, and sewerage disposal — frequently double the headline water utility invoice.
Energy
Induction motors, HVAC chiller loops, industrial lighting, refrigeration circuits, servers, and compressed air systems. Energy offers immediate payback opportunities because most commercial facilities run on inherited setpoints untouched since commissioning.
Materials
Raw feedstocks, primary/secondary packaging, shop consumables, and indirect processing aids. Every percentage point of material scrap embeds all the electrical power, water, and transport already invested into that input — making material waste the most expensive operational loss.
Waste
Generation, sorting, temporary storage, transport logistics, and licensed disposal. Scrap represents purchased inventory turned into liability: enterprises pay to buy it, pay to discard it, and retain legal liability for its ultimate destination.
Building a startup in sustainable operations, utility telemetry, or circular waste management?
This represents one of the rare commercial software spaces with immediate economic ROI: automated power and water submetering, leak detection algorithms, circular waste tracking, and compliance reporting fund themselves directly through utility bill reductions. Escalating supply chain mandates from multinational buyers accelerate enterprise purchasing decisions.
The stumbling block is rarely enterprise demand: it is advancing beyond concepts to deliver an operational tool that measures what matters and proves measurable financial savings. Shinier Accelerator structures this transition with proven product methodologies, requirements modeling, and expert technology co-founding.
How to tie economic value directly to water, energy, materials, and waste?
The initial step establishes the functional unit — the business value metric occupying the numerator. It must remain stable, auditable, and operationally intuitive. In manufacturing, it is typically metric tons or units produced; in service firms, customers served or service orders executed; in software, monthly active users or thousands of cloud API requests. Net revenue acts as a universal external benchmark, yet carries a flaw: inflationary price increases artificially improve the ratio without physical optimization. Best practice tracks both physical and financial intensity metrics simultaneously.
The second step calculates the fully loaded cost of each resource rather than relying on face tariffs. Water encompasses pumping power, heating, softening agents, and sewer surcharges. Energy includes peak demand penalties, power factor fines, and time-of-use tariffs. Materials carry freight, shrinkage, and obsolescence. Waste aggregates handling labor, regulatory hauling, and the original material acquisition cost. Surfacing fully loaded costs rapidly transforms seemingly marginal savings projects into attractive sub-year payback investments.
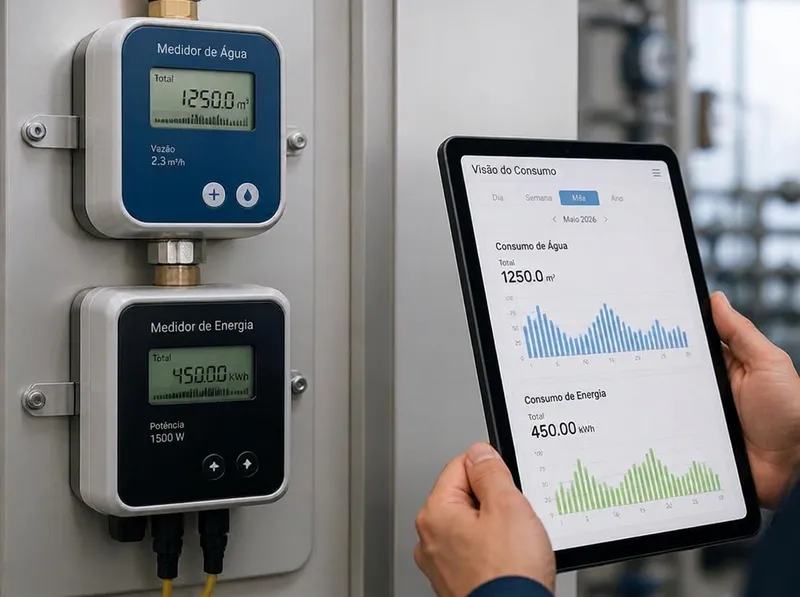
The third step bridges macro consumption with discrete plant processes. Aggregated monthly utility bills prevent diagnostic action; they merely state that capital was expended. Submetering critical plant areas, production lines, or heavy utility loads converts passive accounting into actionable operational intelligence by highlighting where surges occur and which shifts cause them. Measuring the vital 20% of equipment responsible for 80% of loads resolves the diagnostic deficit.
Which paired environmental and financial metrics should operations track?
The most damaging structural mistake is sustaining segregated dashboards: an environmental report curated by sustainability staff, and a financial dashboard guarded by controllers. This division perpetuates conflicting priorities. The remedy is a unified management matrix where every row presents the raw physical consumption metric, the operational intensity ratio, and the corresponding financial cost. Adopting GRI 302, 303, and 306 definitions guarantees international audit comparability.
| Physical Metric | Intensity Ratio | Financial Translation |
|---|---|---|
| Total energy consumption (kWh) by source | kWh per production unit and per revenue dollar | Unit energy cost, peak demand charges, and tariff escalation exposure |
| Water withdrawal and consumption (m³) by source | m³ per production unit and per on-site employee | Fully loaded water cost: intake tariffs, treatment chemistry, and sewer charges |
| Raw material intake and scrap generation rate | Kg of input required per finished unit delivered | Cost of scrap raw material plus sunk transformation utility costs |
| Solid waste generated by stream and destination | Kg of waste per output unit and landfill diversion % | Net disposal tipping fees minus revenues from recycled material sales |
| GHG emissions from Scope 1 and Scope 2 energy | Kg CO₂e per discrete functional unit | Exposure to carbon pricing mechanisms and supply chain procurement hurdles |
| Production downtime caused by utility interruptions | Unscheduled outages per 1,000 operating hours | Cost of idle operator hours, defective rework, and batch contamination losses |
Three core governance rules maintain matrix defensibility. First, establish a verified historical baseline spanning at least twelve consecutive months to decouple seasonal climate shifts from actual efficiency gains. Second, always report absolute consumption alongside intensity metrics: expanding sales by 40% while trimming intensity by 10% still increases absolute environmental draw. Third, designate a single named operational owner per metric — ideally the department head accountable for that budget line.
How to prioritize resource efficiency interventions by ROI and impact?
Thorough operational audits generate long lists of recommendations that exceed capital reserves and engineering bandwidth. Effective triage maps initiatives across three axes: carbon and material impact avoided, bottom-line financial payback, and engineering friction. The winning strategy implements rapid low-capex wins first, uses immediate utility savings to capitalize structural engineering upgrades, and shelves high-cost low-yield ideas until primary systems are optimized.
Wave 1 — Immediate Low-Capex Wins
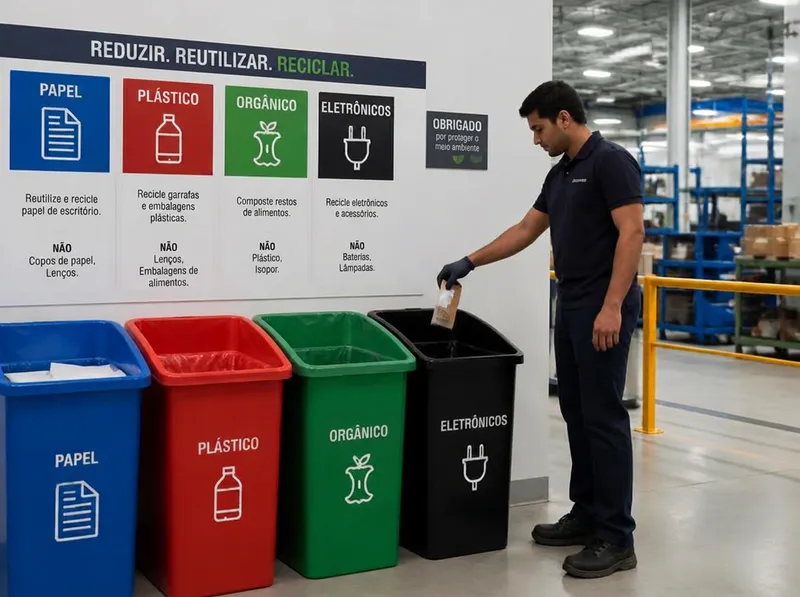
Compressed air leak repairs, thermal setpoint calibrations, scheduled off-shift equipment shutdowns, operating schedule optimization, and systematic waste stream segregation. These require negligible capital, show up on next month's utility invoices, and build organizational momentum.
Wave 2 — Structural Engineering Upgrades
VFD motor retrofits, LED high-bay lighting, process water recycling loops, flue gas heat recovery exchangers, automated utility controls, and optimized packaging geometry. These require capital expenditure but deliver predictable paybacks — self-funded by Wave 1 cash flow.
Wave 3 — Strategic Transformation
Bio-based feedstock substitutions, comprehensive closed-loop process re-engineering, on-site renewable microgeneration, and modular product designs. These represent multi-year strategic capital allocations that should only be deployed once fundamental operational waste is eliminated.
How to prevent resource efficiency from triggering the rebound effect?
The rebound effect (Jevons paradox) occurs when efficiency improvements reduce the marginal cost of utilizing a resource, stimulating increased total consumption that cancels anticipated savings. Switching to high-efficiency LED fixtures only to leave warehouse lighting illuminated around the clock because 'it consumes so little' is the domestic archetype. In industrial operations, it manifests when savings from a process are immediately plowed into unchecked throughput expansion, when cloud computing optimizations lead to bloated database queries, or when water recycling enables an unneeded washing stage.
The rebound effect is not an indictment of efficiency — it is an indictment of measuring intensity ratios in isolation. An enterprise tracking only consumption per unit produced can celebrate continuous improvements while absolute consumption and total invoices climb year over year. Because ecological carrying capacities and corporate utility checks are absolute, solitary intensity tracking masks systemic exposure.
- Establish binding absolute consumption caps alongside intensity targets, and report both concurrently.
- Before declaring operational victory, audit absolute facility consumption against identical prior-year periods.
- Cap liberated operational headroom: when an upgrade frees capacity, explicitly govern whether to reallocate it.
- Direct a mandatory percentage of operational cost savings into subsequent conservation projects rather than uncurbed expansion.
- Re-evaluate functional requirements prior to retrofits: the most efficient processing stage is often one that is eliminated.
- Mandate projected utility consumption modeling during the capital approval gate of any new equipment or service.
Illustrative Eco-Efficiency Cost vs. Environmental Impact Matrix
The matrix below provides an operational decision template rather than static dogma: specific financial returns depend on local utility rates, plant scale, and process thermodynamics. What should be replicated is the structural framework: evaluating every prospective initiative simultaneously across capex requirements, environmental abatement, payback horizon, and implementation rank.
| Initiative | Capex | Environmental Impact | Financial Payback | Implementation Priority |
|---|---|---|---|---|
| Compressed air and process water acoustic leak repair program | Low | High | Rapid (< 3 mos) | 1 — Execute immediately |
| HVAC and chiller setpoint calibration and off-shift setback controls | Very Low | Medium | Immediate | 1 — Execute immediately |
| Automated scheduled shutdown of idle equipment outside production shifts | Very Low | Medium | Immediate | 1 — Execute immediately |
| High-resolution submetering on critical electrical and water lines | Low | Indirect | Medium (< 1 yr) | 2 — Strategic Enabler |
| Traceable segregation and certified diversion of recyclable waste | Low | High | Medium (< 1 yr) | 2 — Strategic Enabler |
| IE4 premium efficiency motor and variable frequency drive retrofits | Medium | High | Medium (1-2 yrs) | 3 — Plan and Capitalize |
| Industrial rinse water recycling loops and boiler flue heat recovery | High | Very High | Long-term (2-4 yrs) | 3 — Plan and Capitalize |
| On-site rooftop solar PV and microgrid battery energy storage | Very High | High | Long-term (> 5 yrs) | 4 — Defer to Later Phase |
| Complete bio-based packaging and raw material feedstock substitution | Variable | Very High | Uncertain | 4 — Defer to Later Phase |
90-Day Tactical Roadmap to Eliminate Operational Waste and Costs
Ninety days cannot reconstruct an entire enterprise, but they are ample to transition from corporate rhetoric to verified financial savings — unlocking the credibility and capital needed for subsequent engineering phases. The environmental management standard provides the skeleton: context, significant impacts, operational controls, and management review. Below is this framework distilled into three 30-day operational sprints.
Days 1 to 30 — Baseline & Diagnostic
- Audit twelve trailing months of utility invoices for water, power, fuels, and solid waste disposal.
- Establish the primary functional unit and compute initial baseline resource intensities.
- Identify and map the top five thermal, electrical, and scrap-generating processes.
- Appoint accountable operational metric owners embedded directly within facility management.
- Execute an off-shift visual audit to document obvious leaks, uninsulated lines, and running equipment.
Days 31 to 60 — Rapid Low-Capex Execution
- Repair identified compressed air line leaks and hydraulic water valve seals.
- Recalibrate plant thermostat setpoints, operating schedules, and off-shift shutdown routines.
- Deploy high-visibility scrap segregation stations paired with brief 15-minute floor training.
- Install digital telemetry submeters across the five priority load points mapped in Phase 1.
- Publish the inaugural unified operational dashboard displaying consumption, intensity, and costs.
Days 61 to 90 — Consolidation & Scaling
- Compare trailing 30-day absolute consumption and intensity against historical baseline averages.
- Quantify documented bottom-line cost savings and validate numbers with the finance department.
- Populate the Cost vs. Impact Matrix using verified facility engineering data.
- Approve Wave 2 engineering retrofits self-funded by Wave 1 utility bill savings.
- Institutionalize monthly operational reviews tracking dual absolute and intensity progress targets.
Eco-efficiency is disciplined operations, not corporate branding
The temptation across corporate sustainability is starting with communications and press releases. In eco-efficiency, that shortcut fails quickly because utility bills provide inescapable verification: water accounts, electricity statements, scrap weigh-bills, and disposal manifests reveal operational reality regardless of corporate claims. An enterprise that successfully curtailed consumption shows verifiable decreases across all four records simultaneously; an enterprise relying merely on PR shows none.
The durable path is pragmatic and iterative: measure with existing data, select an honest functional unit, eliminate visible operational waste first, finance capital upgrades through realized savings, and govern monthly progress using absolute caps alongside intensity metrics. Executed with this discipline, eco-efficiency ceases to be an elective sustainability brochure and becomes what it was always intended to be: world-class operations engineering yielding the agreeable outcome of lower overhead and smaller environmental footprints.
Referências
- WBCSD. Eco-efficiency and Resource Productivity. The seminal business council framework that coined and popularized eco-efficiency as an operational business equation: delivering competitively priced goods that satisfy human needs while progressively reducing environmental intensity throughout life cycles. Explore WBCSD Resource Productivity Work
- UNEP. Resource Efficiency. Broadens the industrial efficiency paradigm to global macroeconomic scales, illustrating how material extraction and processing drive planetary impacts and why resource productivity dictates trade competitiveness. View UNEP Resource Efficiency Resources
- GRI. Standards 302, 303, and 306. Establishes standardized global accounting protocols for energy consumption (GRI 302), water and effluents (GRI 303), and solid waste management (GRI 306), ensuring audit comparability for enterprise reporting. Review GRI Sustainability Standards
- ISO 14001. Environmental Management Systems. Provides governance architecture: organizational context, significant environmental aspects, operational controls, continuous monitoring, and periodic management reviews to institutionalize conservation programs. Consult ISO 14001 Standard
- SCHMIDHEINY, Stephan. Changing Course. The landmark publication that established eco-efficiency in the modern business lexicon, demonstrating that enterprises capable of manufacturing with diminished resource footprints enjoy structural margin advantages. Explore Changing Course References