
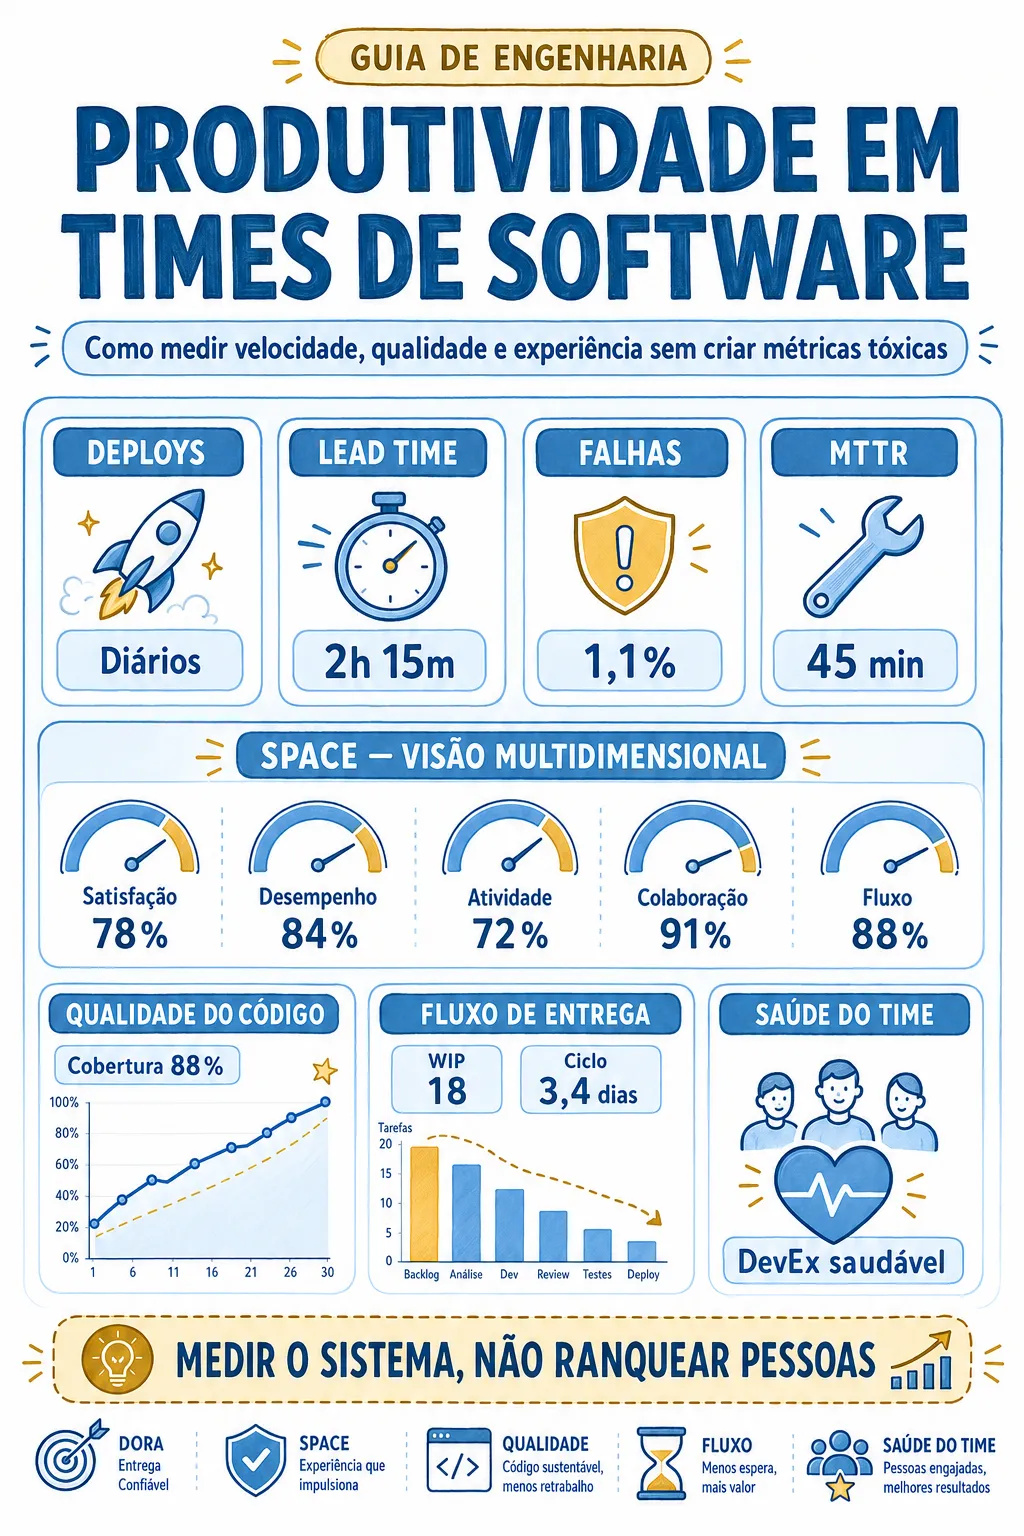
Software Team Productivity: DORA, SPACE and AI Without Vanity Metrics
Lines of code and logged hours do not capture genuine engineering value. Discover how to apply DORA, SPACE, flow metrics, and AI to accelerate deliveries without micromanagement.
Evaluating productivity in software engineering teams is one of the most critical management challenges of the digital era. Unlike assembly line manufacturing, software creation is inherently intellectual, non-linear, and deeply collaborative. When leadership attempts to measure engineers using factory-era metrics, the outcome is counterproductive.
Indicators such as raw commit counts, lines of code produced, or keystroke tracking software are classic vanity metrics. They create an illusion of control while distorting engineering behavior, incentivizing verbose code, and eroding team culture.
Over recent years, rigorous scientific research — notably DORA (DevOps Research and Assessment by Google Cloud) and the SPACE framework (developed by GitHub and Microsoft researchers) — proved that engineering performance is a socio-technical phenomenon balancing delivery velocity, system stability, code architecture, developer satisfaction, and continuous flow.
With the widespread adoption of AI coding assistants (such as GitHub Copilot, Cursor, and Claude Code), measuring true throughput has become essential: while AI generates syntax in seconds, engineering systems must ensure code reaches production reliably without inflating technical debt.
💡 Goodhart's Law in Engineering: "When a measure becomes a target, it ceases to be a good measure." If you reward developers for lines of code, you will receive redundant code; if you reward them for raw task closures, you will receive fragmented, low-value tickets.
Want to optimize velocity and telemetry for your engineering team?
At Shinier, we guide tech founders, CTOs, and engineering leaders in implementing DORA and SPACE frameworks, refining CI/CD pipelines, and accelerating software delivery without falling into micromanagement traps.
Why Lines of Code and Logged Hours Fail to Measure Engineering Productivity
In software engineering, the quantity of keystrokes or text written has zero — often negative — correlation with solved business problems. A senior engineer might spend three days investigating a concurrency bottleneck and resolve it by deleting 50 redundant lines. Under legacy output metrics, that would register as 'negative productivity'.
As classically established by Tom DeMarco and Timothy Lister in Peopleware, software development is creative cognitive work. Applying mechanical metrics creates systemic failure modes:
Lines of Code (LOC)
Rewarding lines of code drives copy-pasting, bloated abstractions, and unnecessary complexity. Clean, resilient code is concise. Writing less code to solve the same problem minimizes attack surface, bug density, and ongoing maintenance costs.
Logged Hours & Timesheets
Tracking hours measures digital presence, not problem-solving efficacy. This practice encourages inflated estimates, undermines institutional trust, and rapidly accelerates developer burnout.
Commit and Pull Request Volume
Without contextual code review, counting commits incentivizes artificial code splitting and premature Pull Request submissions designed solely to game individual activity dashboards.
To escape this trap, high-performing technology organizations have shifted to frameworks evaluating business delivery outcomes and socio-technical flow health, discarding mechanical input metrics entirely.
What are the 4 Core DORA Metrics and How Do They Balance Speed With Stability?
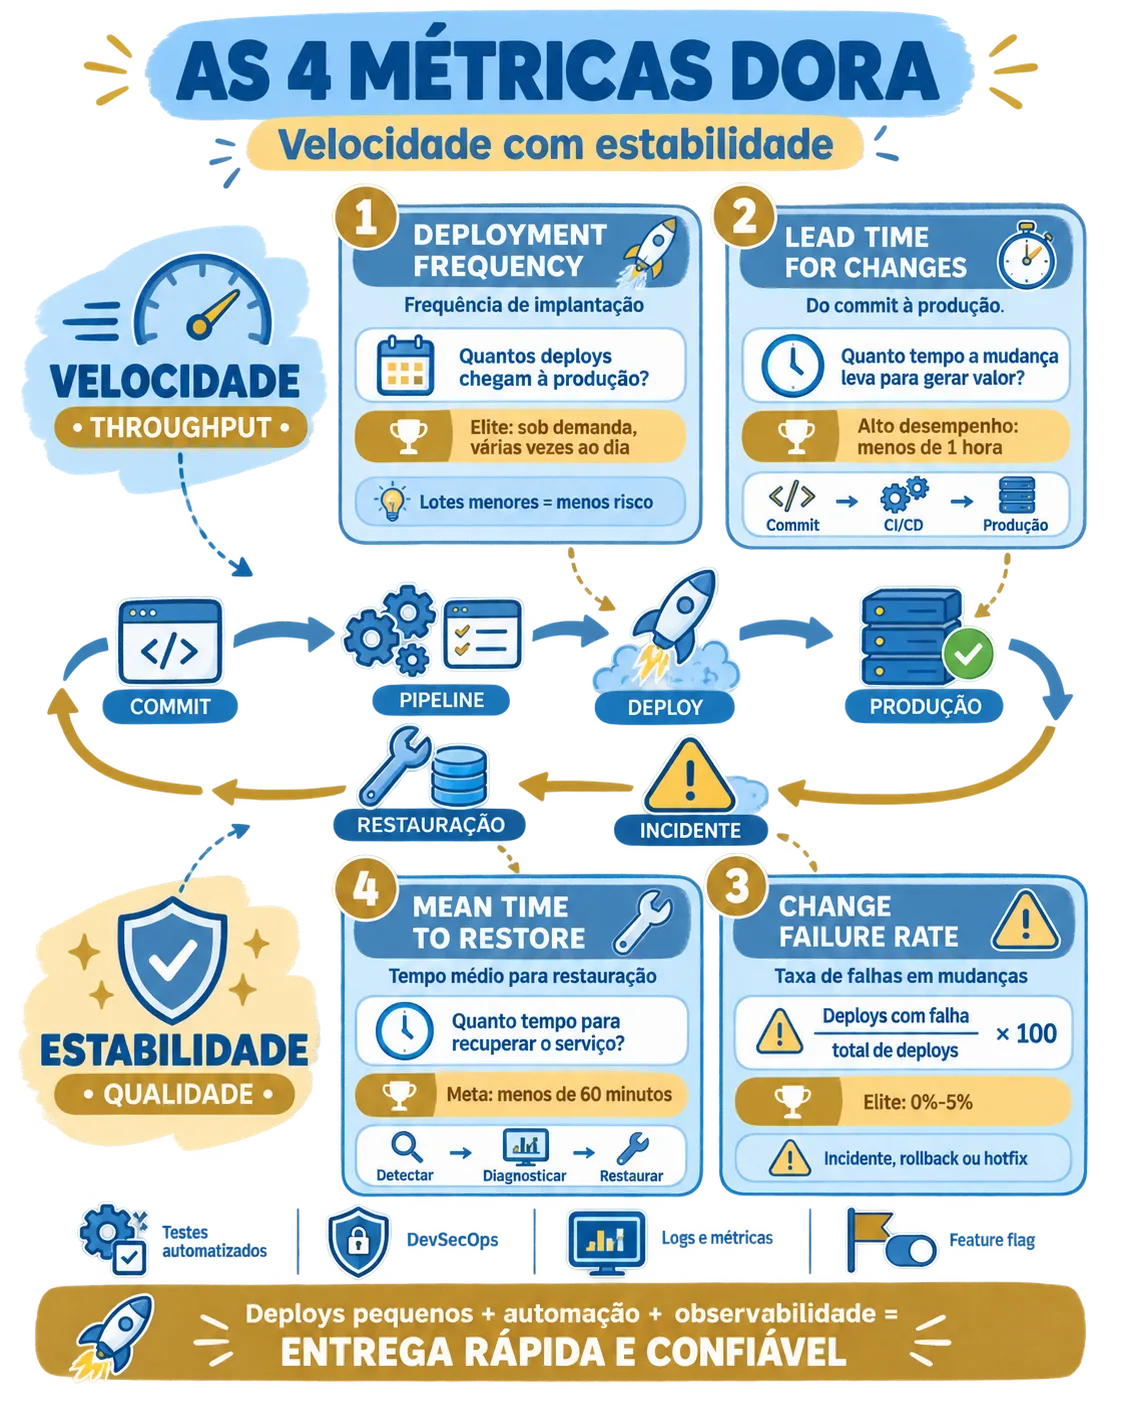
The DORA (DevOps Research and Assessment) framework was developed through multi-year statistical research led by Dr. Nicole Forsgren, Gene Kim, and Jez Humble, surveying over 32,000 professionals globally. DORA's breakthrough insight was proving that delivery velocity and operational stability are mutually reinforcing rather than opposing trade-offs.
DORA structures engineering performance across four vital metrics, divided equally between throughput (velocity) and stability (quality):
1. Deployment Frequency (DF)
Deployment Frequency measures how often validated code is deployed successfully to production. In lower-maturity teams, releases occur bi-weekly or monthly in high-risk batches. Elite engineering teams deploy on demand multiple times per day.
Increasing deployment frequency forces teams to shrink batch sizes. Smaller batches minimize integration friction, facilitate peer reviews, eliminate merge conflicts, and make root-cause debugging straightforward.
2. Lead Time for Changes (LTC)
Lead Time for Changes measures the elapsed time from initial commit to code running live in production. It benchmarks pipeline automation, test coverage, and organizational agility.
High-performing teams maintain LTC under one hour via automated testing suites, integrated security checks, and robust CI/CD pipelines. When LTC drags into weeks, the delay is rarely coding time — it is idle wait time in manual approval queues.
3. Change Failure Rate (CFR)
Change Failure Rate calculates the percentage of production deployments triggering service degradation, critical bugs, security vulnerabilities, or rollbacks. It serves as the quality guardrail safeguarding system reliability.
Elite organizations maintain a CFR between 0% and 5%. An elevated CFR signals skipped automated tests or superficial peer reviews. DORA proves teams can accelerate delivery while keeping failure rates near zero.
4. Mean Time to Restore (MTTR)
Mean Time to Restore benchmarks how long a team takes to diagnose and recover from an unplanned production incident. In distributed cloud systems, failures will occur; elite teams recover within minutes.
Achieving sub-hour MTTR requires modern telemetry (structured logging, distributed tracing), proactive alerts, and instantaneous mitigation mechanisms like feature flags and automated one-click rollbacks.
What is the SPACE Framework and What are Its 5 Productivity Dimensions?
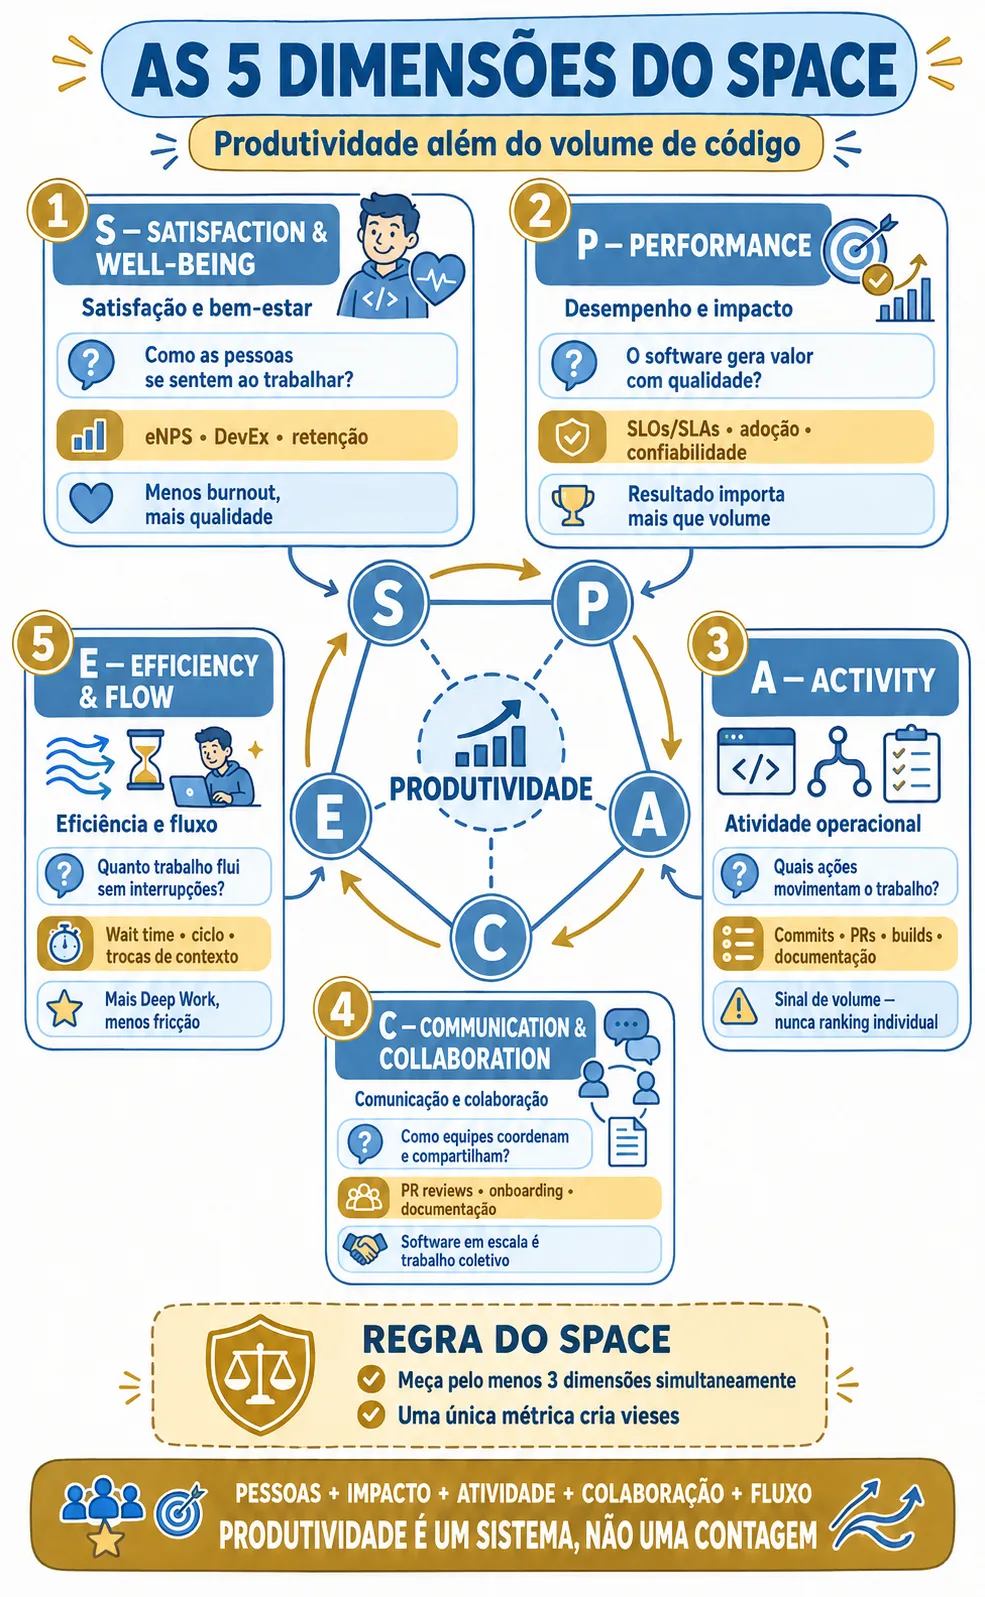
Co-authored by researchers from GitHub, Microsoft Research, and Victoria University (published in ACM Queue), the SPACE framework addresses the limits of purely mechanical metrics, showing developer productivity cannot be captured by a single proxy.
SPACE organizes engineering productivity across five interconnected socio-technical dimensions. Teams should select metrics across at least three dimensions simultaneously:
1. Satisfaction & Well-being (S)
The Satisfaction & Well-being dimension tracks how fulfilled engineers feel regarding daily tasks, tooling, collaboration, and culture. Empirical research links burnout directly to high turnover, degraded code quality, and operational defects.
Measured non-intrusively via periodic anonymous developer eNPS surveys, toolchain friction assessments (DevEx), and engineering retention rates.
2. Performance (P)
The Performance dimension evaluates the outcome and tangible impact of engineering output, aligning software quality with business goals rather than raw output volume.
Typical indicators include service level objectives (SLOs/SLAs), feature customer adoption, regression-free releases, and strategic business impact.
3. Activity (A)
The Activity dimension counts operational events completed throughout development. While easily extracted by git systems, SPACE stresses that activity counts must never be evaluated in isolation or assigned as personal targets.
Examples include PRs merged, code reviews submitted, technical specifications drafted, and automated test runs — serving as capacity indicators rather than individual leaderboards.
4. Communication & Collaboration (C)
The Communication & Collaboration dimension analyzes how effectively teams coordinate dependencies, document knowledge, and interact. Software engineering is a team sport; siloing is the top cause of integration lag.
Analyzed through PR review responsiveness, documentation freshness, new engineer onboarding speed, and cross-functional handoff efficiency.
5. Efficiency & Flow (E)
The Efficiency & Flow dimension assesses developers' ability to execute uninterrupted deep work with minimal friction, meeting fragmentation, or blocking handoffs.
Tracked through queue wait times, daily context switches, cycle time progression, and self-reported blocks of uninterrupted coding focus.
How to Harmonize Speed, Quality, Satisfaction, and Collaboration
Single metrics provoke distortions. Focusing exclusively on deployment frequency risks cutting testing corners. Healthy engineering maintains a balanced scorecard across four interdependent pillars:
1. Speed + Quality
DORA research proves elite teams do not trade speed for quality — they achieve both. High velocity stems from automated CI/CD and trunk-based development, enabling small, rapid releases with negligible defect rates.
2. Satisfaction + Well-being
Supported engineers write cleaner, more resilient software. SPACE's satisfaction pillar evaluates retention, DevEx tooling fluidity, and workload sustainability.
3. Collaboration & Communication
Modern software relies on shared ownership. Tracking PR review times and comprehensive architecture docs eliminates single points of failure.
4. Efficiency & Flow
Entering cognitive flow requires dedicated blocks of uninterrupted deep work. Eliminating fragmented calendars significantly multiplies creative engineering output.
Balancing these dimensions ensures accelerated software delivery remains sustainable, protecting developer well-being alongside system reliability.
How to Measure Capacity and Slack Time Without Micromanagement
Many managers worry that without constant tracking, engineers will idle. Yet micromanagement is the costliest way to steer engineering. Productive capacity must be analyzed from a systems perspective, not personal surveillance.
Healthy Utilization vs Chronic Overload
Under queuing theory (Kingman's formula), a system running at 100% human resource utilization exhibits near-infinite wait times. Maintaining 15% to 20% intentional slack time is vital for refactoring, tech discovery, emergencies, and innovation.
Focusing on Queue Bottlenecks (Wait Time)
When an engineer is stalled, 90% of the time they are blocked waiting on specifications, credentials, QA environments, or PR reviews. Leadership must resolve systemic bottlenecks rather than policing individuals.
Psychological Safety Culture
Google's Project Aristotle demonstrated that psychological safety is the foremost prerequisite of high-performing teams. Environments empowering engineers to admit errors and experiment outperform fear-driven cultures.
When AI Assistants Accelerate Output vs Simply Shifting Bottlenecks
GitHub Research studies show AI coding tools like Copilot help developers complete discrete coding tasks up to 55% faster. However, typing speed only translates to business value if surrounding pipelines are equipped to absorb increased volume.
Genuine AI Productivity Gains
Real acceleration occurs in boilerplate elimination, mock generation, test scaffolding, faster syntax lookups, and prolonged deep work with less cognitive fatigue.
Bottleneck Displacement Risks
Risks arise when uncurated, large AI-generated PRs flood review queues, elevate technical debt through unverified code, and overwhelm QA pipelines, driving up Change Failure Rates.
To maximize AI investments, engineering leadership must ensure code review discipline, automated testing, and architectural governance scale in tandem with code generation.
Which Flow Metrics Reliably Forecast Software Deliveries?
Rather than relying on subjective story-point estimates, modern engineering relies on empirical historical flow metrics:
1. Throughput
Total completed work items (stories, bugs, tasks) deployed to production per unit of time, establishing statistical baselines for forecasting.
2. Work in Progress (WIP)
Active items started but not yet completed. Limiting WIP is the primary lever to compress cycle times (Little's Law).
3. Cycle Time Scatterplot
Statistical distribution of elapsed time per item, enabling confidence percentiles (e.g., '85% of tasks ship within 4 days').
4. Cumulative Flow Diagram (CFD)
Visualizes work accumulation across workflow stages, surfacing bottlenecks and queue instability instantly.
Engineering Team Performance Scorecard Framework
Below is a balanced Engineering Performance Scorecard synthesizing DORA, SPACE, and flow telemetry across operational maturity tiers:
| Dimension | Metric / Indicator | Evolving (Low/Medium) | Elite / High Performance |
|---|---|---|---|
| DORA Velocity | Deployment Frequency | 1x to 2x per month | Multiple deploys per day |
| DORA Velocity | Lead Time for Changes | 1 to 4 weeks | Under 1 hour |
| DORA Stability | Change Failure Rate | > 15% to 30% | 0% to 5% |
| DORA Stability | Mean Time to Restore (MTTR) | Over 1 day | Under 30 minutes |
| SPACE Human | Satisfaction & Well-being (eNPS) | Below +20 | Above +50 |
| Flow & Forecasting | Flow Efficiency (%) | < 10% (high queue wait) | > 35% to 50% active touch time |
How to Implement This Scorecard in 30 Days:
- Week 1
Connect Repositories, CI/CD, and Automate DORA Calculation
Integrate code repositories (GitHub, GitLab, Bitbucket) and CI/CD pipelines (GitHub Actions, ArgoCD, Jenkins) with telemetry tooling. Calculate the four DORA metrics passively via webhooks, requiring zero manual reporting from engineers.
- Week 2
Launch Bi-Weekly DevEx Surveys and Friction Mapping
Deploy an anonymous, lightweight survey (3 to 5 questions every 14 days) capturing team eNPS and toolchain satisfaction (DevEx), catching burnout before talent retention is compromised.
- Week 3
Enforce WIP Limits and Compress Queue Wait Times
Establish strict Work in Progress (WIP) limits across Kanban board columns, notably in Code Review and QA stages, preventing context switching and shrinking Lead Time for Changes.
- Week 4
Consolidate Scorecard Review in Team Retrospectives
Review monthly scorecard trends during sprint retrospectives to celebrate flow achievements, diagnose systemic pipeline friction, and plan continuous improvements (Kaizen).
Adopting this socio-technical scorecard replaces unproductive micromanagement with an engineering culture grounded in psychological safety, business value, and sustainable pace.
Referências
- DORA. Accelerate State of DevOps. Google Cloud's global research initiative on high-performing software delivery, establishing core velocity and stability metrics. Visit DORA official portal
- FORSGREN, Nicole et al. The SPACE of Developer Productivity. Landmark paper published in ACM Queue offering a multi-dimensional lens spanning Satisfaction, Performance, Activity, Communication, and Efficiency. Read ACM Queue scientific publication
- GITHUB. Research on Copilot Productivity and Happiness. Empirical study measuring AI assistant impacts on developer speed, cognitive flow, and work satisfaction. Read GitHub research report
- KIM, Gene; HUMBLE, Jez; FORSGREN, Nicole. Accelerate. Statistical research across thousands of companies proving software delivery agility directly accelerates enterprise performance. Explore Accelerate publications
- DEMARCO, Tom; LISTER, Timothy. Peopleware: Productive Projects and Teams. Classic management text demonstrating software development challenges are primarily socio-technical and sociological rather than purely technical. View Peopleware on O'Reilly
- ATLASSIAN. Agile Reports and Flow Metrics Overview. Practical guide on flow telemetry, cumulative flow diagrams (CFD), and capacity planning for agile predictability. View Atlassian Jira reports guide