
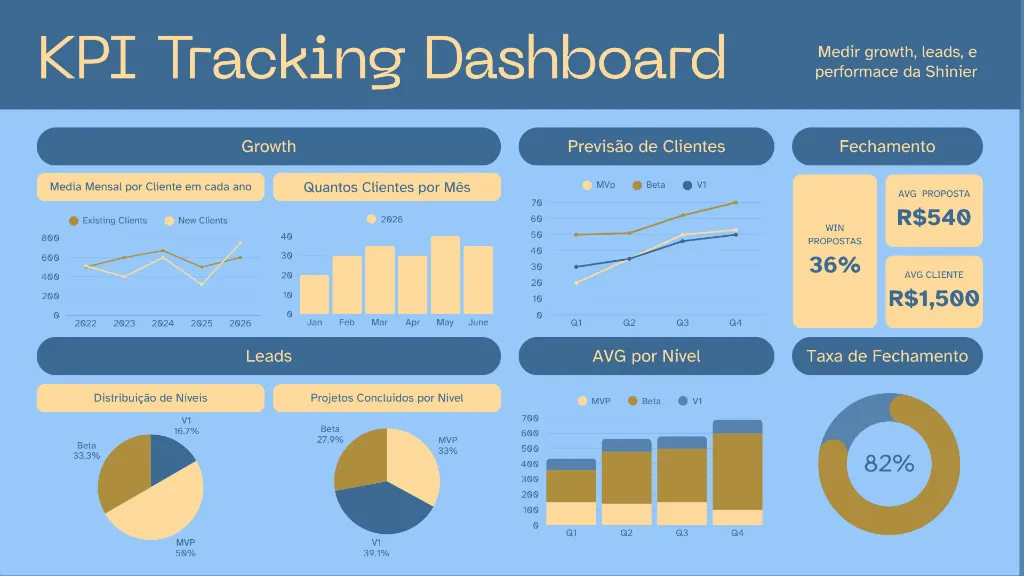
KPIs in Startups: The Complete Guide to Measuring Effectiveness and Performance in 2026
Effectiveness is not doing more — it's doing what matters. Learn how to define the right KPIs per startup stage, avoid vanity metrics, and use dashboards to make game-changing decisions.
In 2026, data has become a commodity. Every startup has Google Analytics, Mixpanel, a financial spreadsheet, a CRM full of statuses, and a pretty Notion dashboard. Even so, most founders we talk to at Shinier Accelerator can't confidently answer a simple question: "what is the ONE metric that, if it goes up, means your startup is winning?".
This is the central problem that a KPI (Key Performance Indicator) solves. It's not a dashboard, it's not a chart, it's not a green line going up. It's the numerical translation of what your strategy calls effectiveness — doing the right thing, at the right time, for the right person, with a measurable result.
This guide was written for founders who are tired of looking at numbers that don't change decisions. We will cover: the concept of effectiveness vs. efficiency vs. efficacy, what a KPI is (and what it is not), the main KPIs by startup stage (ideation, validation, traction, and scaling), financial metrics like CAC and LTV, OKRs, digital transformation, and the technology that connects all this into a dashboard that's actually used for decision-making.
The premise of the article is straightforward: a startup that doesn't measure, doesn't learn. A startup that measures the wrong thing, learns the wrong thing — and that's worse than not measuring.
What is a KPI? (And why 90% of startups confuse it with a metric)
KPI stands for Key Performance Indicator. The most important word in the acronym is the first one: Key. Decisive. Anything that doesn't change a decision is not a KPI — it's just a metric.
David Parmenter, a global reference on the subject, classifies indicators into four levels:
- KRI (Key Result Indicators): show what happened in the past (e.g., quarterly revenue, annual avg NPS). For the board.
- RI (Result Indicators): process outcomes (e.g., regional sales, cohort churn). For managers.
- PI (Performance Indicators): operational actions (e.g., emails sent, calls made). For teams.
- KPI (Key Performance Indicators): the 5 to 10 indicators that, if monitored in real-time and adjusted quickly, change the future of the business.
Most of what a startup calls a "KPI" is actually an RI or PI. A good KPI has three non-negotiable characteristics: it is frequent (ideally daily or weekly), it has a clear owner (a person, not a team), and it triggers immediate action when it varies.
Effectiveness, Efficiency, and Efficacy — what's the difference?
These three words are often used synonymously. They aren't. And KPIs measure different things for each:
- Efficiency: doing more with less. Typical KPIs: cost per lead, sales cycle time, development throughput.
- Effectiveness: achieving the defined objective. Typical KPIs: conversion rate, % of OKRs met, market share gained.
- Efficacy (Long-term Impact): real long-term impact. Typical KPIs: LTV/CAC ratio, sustained NPS, 12-month cohort retention.
A startup can be brutally efficient at building a product no one wants — efficiency without effectiveness is like rowing faster in the wrong direction.
Define your startup's KPIs and OKRs with Shinier's OKR Dashboard
Stop defining metrics in random spreadsheets. Use Shinier's OKR Dashboard tool to structure quarterly objectives, connect KPIs to each Key Result, and track progress with AI that suggests adjustments when the pace slows down.
✓ KPI templates by stage · ✓ AI Suggestions · ✓ Integrated with other Shinier tools
Why startups that don't measure performance crash
A CB Insights survey with over 110 post-mortems points to clear patterns — almost all measurable if a KPI had been defined before the problem hit.
Source: CB Insights — "The Top 12 Reasons Startups Fail"

How to define a KPI: the SMART framework applied to startups
The SMART criteria is old, and it survived because it works. Adapted for startups:
- S — Specific: "increase conversion" doesn't count. "Conversion from trial → paid in the Pro plan" does.
- M — Measurable: it must have a number, a clear formula, and a single source of truth.
- A — Achievable (but Ambitious): an impossible goal demotivates, a weak goal breeds complacency.
- R — Relevant: connected to the North Star. If the goal is met and the startup worsens, the KPI is wrong.
- T — Time-bound: has a deadline (sprint, quarter, year). Without a deadline, it's an intention.
Top KPIs by startup stage
A good KPI is relative to the stage. Asking for LTV from an ideation-stage startup is as wrong as asking for qualitative interviews from a scale-up. Each phase has a main question — and the KPIs answer it.
Does the problem exist and is it painful?
- • Number of interviews with target audience
- • % that confirm the problem
- • Declared willingness to pay
- • Problem frequency (times/month)
Does the solution resolve it?
- • Smoke test conversion (≥3% is good)
- • Early user engagement
- • Qualitative NPS (interview)
- • Time to 'aha moment'
Can we grow with positive unit economics?
- • MRR / ARR (recurring revenue)
- • CAC and payback (months)
- • Monthly churn (<5% is a goal)
- • LTV/CAC ratio (>3x is healthy)
How to accelerate without breaking?
- • MoM or YoY Growth
- • Net Revenue Retention (>110%)
- • Gross margin
- • Burn multiple (burn ÷ ARR generated)
The KPI families every startup needs to monitor
Regardless of the stage, every digital business needs to balance five families of indicators. Neglecting one of them is like driving while only looking at the speedometer: you know the speed, but you don't know how much fuel you have or if you're going to crash.
Financial
MRR, ARR, burn rate, runway, gross margin, gross profit, EBITDA, average ticket.
Acquisition & Marketing
CAC, CPL, ROAS, channel conversion rate, organic traffic, SQL/MQL ratio.
Product
DAU/MAU ratio, D1/D7/D30 retention, time-to-value, feature adoption, NPS.
Retention & Revenue
Voluntary churn, involuntary churn, expansion MRR, LTV, NRR, GRR.
Operations & Team
Delivery lead time, deploy frequency, eNPS, turnover, % of OKRs met.
Strategic / North Star
A single metric that represents value delivered to the customer (e.g., 'nights booked' at Airbnb).
What is Digital Transformation — and why it requires new KPIs
Digital transformation, in 2026, is no longer an IT agenda, it's a board agenda. It's not swapping Excel for SaaS. It's reconfiguring the business model based on data, automation, and AI to deliver value that wasn't possible before. And this reconfiguration renders several traditional KPIs obsolete.
Companies that billed by hours worked are migrating to billing by results. Industries that measured machine OEE now measure algorithm OEE. SaaS startups stopped looking only at MRR and started looking at Net Revenue Retention (NRR) — because expansion within the customer base has become the main growth lever.
What changes in KPIs with digital transformation
- From "outputs" to "outcomes": it no longer matters how many features you launched, but how much value the user captured.
- From annual to real-time: a dashboard that updates monthly is useless for daily decisions. Data streaming has become the standard.
- From average to cohort: "average retention" hides everything. Monthly cohorts reveal where the leaks are.
- From report to prediction: with AI, the KPI stops being a picture of the past and becomes a projection of the future (churn forecast, predictive LTV).
Without digital transformation, KPIs become anemic. Without well-defined KPIs, digital transformation becomes orphaned. The two agendas walk together — and that's why Shinier's tools for OKR Dashboards, Roadmap Builders, and Budget Planners are built integrated: product KPIs, roadmap KPIs, and cash KPIs need to talk to each other.
OKR and KPI: partners, not competitors
Directs focus
Objectives and Key Results. Defines where the startup wants to go in a timeframe (usually quarterly) and how to know it arrived.
- • Ambitious — reaching 70% is already a win
- • Quarterly, with weekly check-in cadence
- • Top-down in alignment, bottom-up in definition
- • Example: "Become the benchmark in Retail SMBs" with 3 measurable KRs
Measures health
Key Performance Indicator. Measures continuously the health of the business in metrics that exist regardless of the current quarter.
- • Realistic — hitting 100% is expected
- • Continuous — monitored every day/week
- • Operational or strategic, but always "watching"
- • Example: monthly churn < 4% as a permanent ceiling
In practice: the Key Results of an OKR often are KPIs with an ambitious target for the quarter.
The 7 most common mistakes when measuring startup performance
- Measuring vanity. Followers, downloads, "registered users" inflate egos but don't pay payroll. Eric Ries calls them "vanity metrics".
- Measuring everything. A dashboard with 40 indicators is the same as a dashboard with none — no one looks at it.
- No owner. A KPI without a single owner becomes everyone's problem (meaning, no one's).
- Wrong frequency. A weekly KPI reviewed once a month is too late to correct.
- Comparing averages instead of cohorts. The average hides what is on fire.
- Changing the goal all the time. If you change it mid-quarter, the goal was bad or the game changed. Document the reason.
- Not connecting KPIs to decisions. If the number goes up or down and nothing changes next week, the KPI is decorative.
Technology to support KPIs in 2026
The minimum stack we recommend for founders who want reliable dashboards without spending a fortune on tools:
Capture
Google Analytics 4, Microsoft Clarity, Mixpanel or PostHog (open source). For SaaS: Segment as an event router.
Storage & ETL
Supabase or Managed Postgres, with Airbyte or Fivetran to integrate external sources (Stripe, HubSpot, CRM).
Visualization & AI
Metabase, Lightdash, or Shinier's own OKR Dashboard, which already brings AI to suggest adjustments and detect anomalies.
Mini-case: from "guesswork" to a KPI that doubled conversion
A startup accelerated by Shinier ran for 8 months with no defined KPIs — just "MRR" as a vague goal. By implementing the SMART framework and choosing conversion trial → paid in the Pro plan as a weekly KPI, the team discovered:
- • 62% of trials never completed onboarding
- • The "aha moment" happened in the 3rd session, not the 1st
- • Users who used feature X were 4x more likely to convert
Three sprints later, with surgical changes guided by the KPI, conversion jumped from 7.8% to 16.4%. Without increasing traffic, without new investment — just measuring the right thing.

Checklist: implementing KPIs in your startup in 30 days
- Week 1 — Diagnosis. List everything you measure today. Mark what changes a decision (rare) and what is vanity (most).
- Week 2 — North Star. Define ONE metric that represents the value delivered to the customer. Everything that follows must pull this one.
- Week 3 — Strategic KPIs. Choose 3 to 5 KPIs per family (financial, acquisition, product, retention). Apply SMART to each.
- Week 4 — Dashboard and Ritual. Build the dashboard in a single tool (we recommend Shinier's OKR Dashboard). Define the owner, frequency, and weekly review meeting.
- Day 30 — First decision guided by a KPI. If at the end of the month no decision was made because of a KPI, redo the set: they are not actionable.
Want to structure your KPIs with AI, method, and without spreadsheets?
Shinier Accelerator gives you access to the OKR Dashboard, Roadmap Builder, Budget Planner and 20+ integrated tools — all talking to each other so every KPI is connected to a real decision.
Start with the AcceleratorReferências
- KAPLAN, R. S.; NORTON, D. P. The Balanced Scorecard: Translating Strategy into Action. Harvard Business School Press, 1996. Seminal work that structured the modern concept of KPIs. Original article in HBR
- DOERR, J. Measure What Matters: How Google, Bono, and the Gates Foundation Rock the World with OKRs. Penguin, 2018. Reference on OKRs and their relationship with KPIs. Official Website — What Matters
- RIES, E. The Lean Startup. Crown Business, 2011. Defines the concept of 'actionable metrics vs. vanity metrics'. Lean Startup Principles
- MCKINSEY & COMPANY The State of AI in 2024: How organizations are rewiring to capture value — global research on digital transformation, data, and KPIs. McKinsey Report
- CB INSIGHTS The Top 12 Reasons Startups Fail — recurring study based on real post-mortems; 'no market need' and 'ran out of cash' lead for consecutive years. CB Insights Study
- PARMENTER, D. Key Performance Indicators: Developing, Implementing, and Using Winning KPIs. 4th ed. Wiley, 2019. Classifies indicators into KRI, RI, PI, and KPI. Author's Official Website